Measuring Code Performance with NAV Application Profiler
This article brings to attention that the good old tool is still out there and can be incredibly helpful for on-premise Business Central (v 14).


We expect our Business Central or NAV application to perform well to accommodate the highest predicted volume of operations. Finding the root cause of a performance issue is often a challenging task especially if there is no good instrument for that on hand.
If you are running Business Central in the cloud or have converted your solution to AL (including on-premise versions), it is recommended to look into monitoring extensions with Application Insights (an example from Dmitry Katson) which is the industry standard for Microsoft cloud solutions. Otherwise, in case your system is still running on premise where we can use custom .NET libraries, the performance profiler I’m going to talk about in this article is definitely worth a shot.
NAV Application Profiler Is Still Out There
The NAV Application Profiler (EtwPerformanceProfiler) repository description states that it is a sample for profiling application code created by David Worthington and Dmytro Sitnik (while being part of the Dynamics NAV team) in 2013 and announced in 2014. ETW stands for Event Tracing for Windows, and the application is based on the Microsoft.Diagnostics.Tracing.TraceEvent library which, if interested, you could get familiar with by reading the library documentation. One interesting fact I learnt from it is that tracing with the library is asynchronous and therefore has almost no performance impact and it should be safe to run it on a production instance.
About a year ago (mid 2019), shortly after we upgraded NAV 2009 to Business Central version 14 and brought all our data, the load in production indicated some symptoms of code inefficiency by showing messages like a “table was locked by another user”. We needed something that would point us to the bottleneck and do it fast.
Having had a chance to get familiar with NAV Application Profiler before, I urged to try it but quickly realized it hasn’t been updated for some time and the last version it was updated to was NAV 2018 (according to the commit history). I used that opportunity to refresh my C# skills and after some time the profiler started working for our version of BC. Since then, our team has adopted the tool and now runs it every time before deploying a change to the codebase.
The fix should widen the range of supported platforms, the result of which is in the source code of the GitHub repository.
Installation Steps
The NAV Application Profiler repository is public, therefore anyone can clone and play with it. The .NET libraries can be built by Visual Studio 2019 Community edition which can be used for free for open source projects.
In case you would like to just download the installation package, I've build it for you. Please use the following link where I've put them together:
Download NAV Application Profiler files (1.5MB, built on 18/10/2020)
After you have the files, the next actions need to be performed:
- Extract the files.
- Copy the EtwPerformanceProfiler folder to the following locations
- Server Add-ins folder of BC. By default, it’s
C:\Program Files\Microsoft Dynamics NAV\140\Service\Add-ins\(for NAV 2013 it isC:\Program Files\Microsoft Dynamics NAV\80\Service\Add-ins) - Role Tailored Client Add-ins folder which should be
C:\Program Files (x86)\Microsoft Dynamics 365 Business Central\140\RoleTailored Client\Add-ins(C:\Program Files (x86)\Microsoft Dynamics NAV\80\RoleTailored Client\Add-insfor NAV 2013)
- Server Add-ins folder of BC. By default, it’s
- Ensure the Enable Full C/AL Function Tracing is turned on in the instance configuration and restart the instance if it wasn’t.
- Import and compile the objects from the App Objects folder. The BC instance should see the libraries already. However, the libraries might get blocked by the system, which we can resolve by running an Unblock-File PowerShell command or by manually unblocking them in the file properties.
Now that we have our objects compiled, we can proceed to the most exciting part, seeing what are the most time-consuming lines in our code!
Running NAV Application Profiler
The main application profiler page is the page 50000 Performance Profiler, let's run it from the Development Environment.
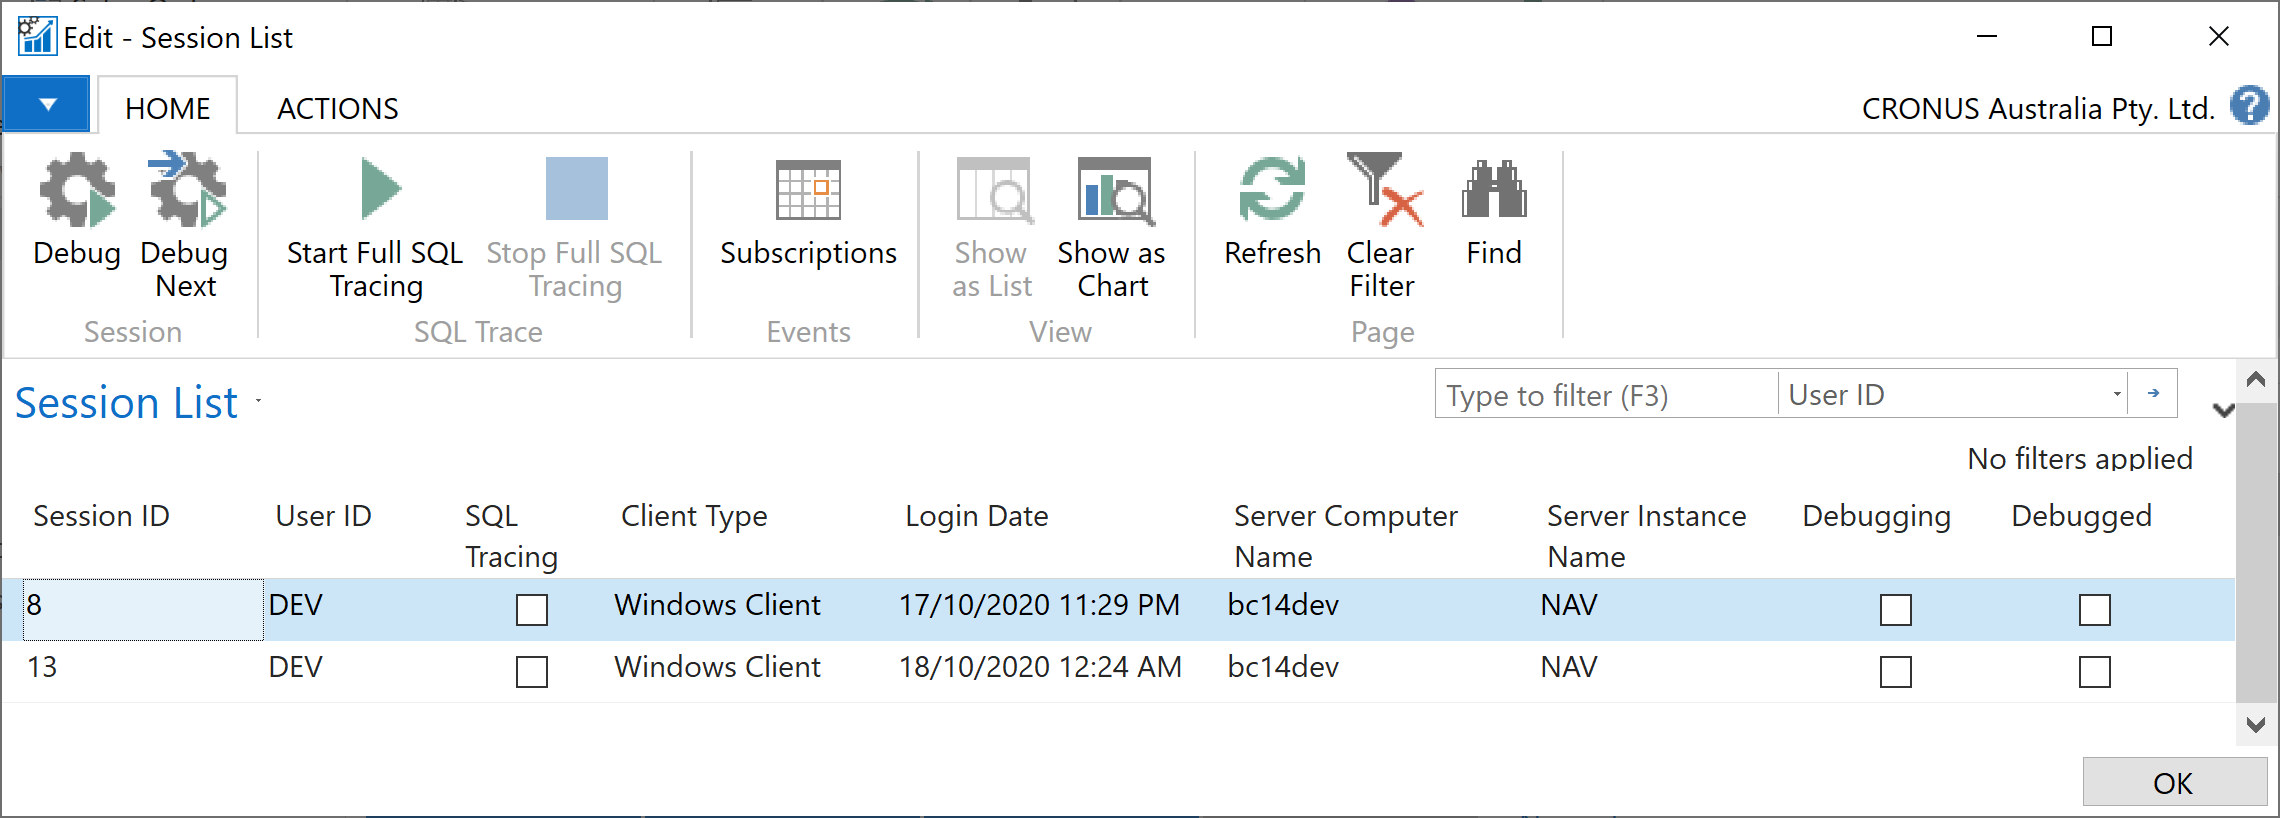
It is possible to trace multiple sessions but we would often target our session to analyze performance. One of the ways of finding out the Session ID is using the Debug Session function and see all running sessions on the instance. I've started another client session to run a user operation example and have now two sessions running, which you can see in the picture below.
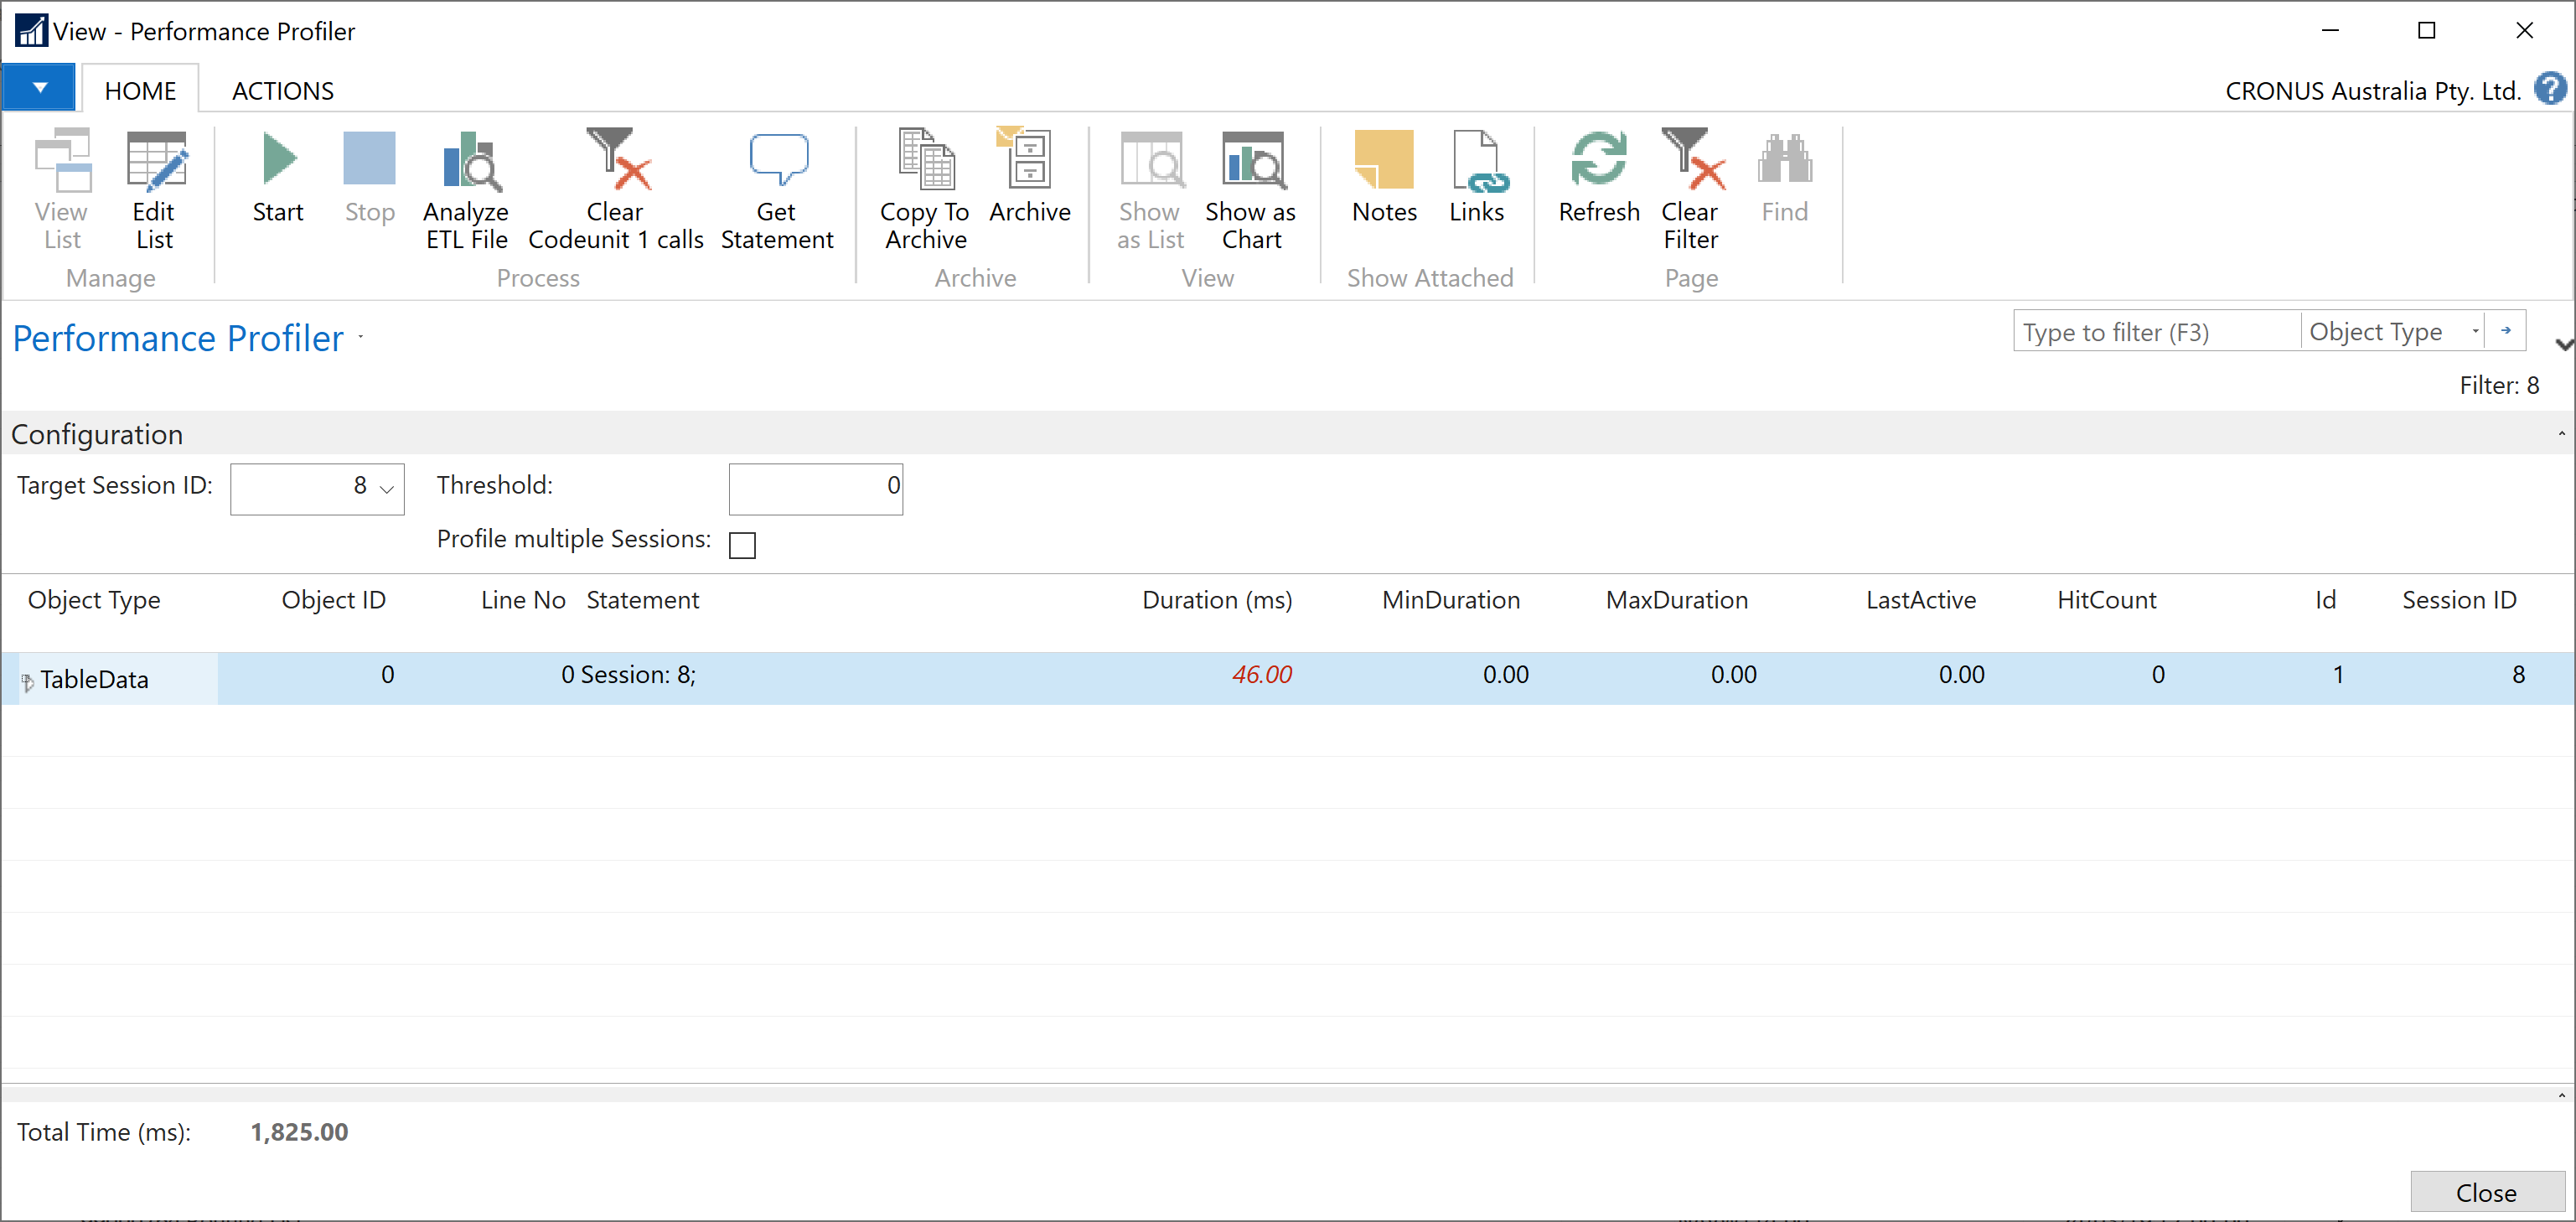
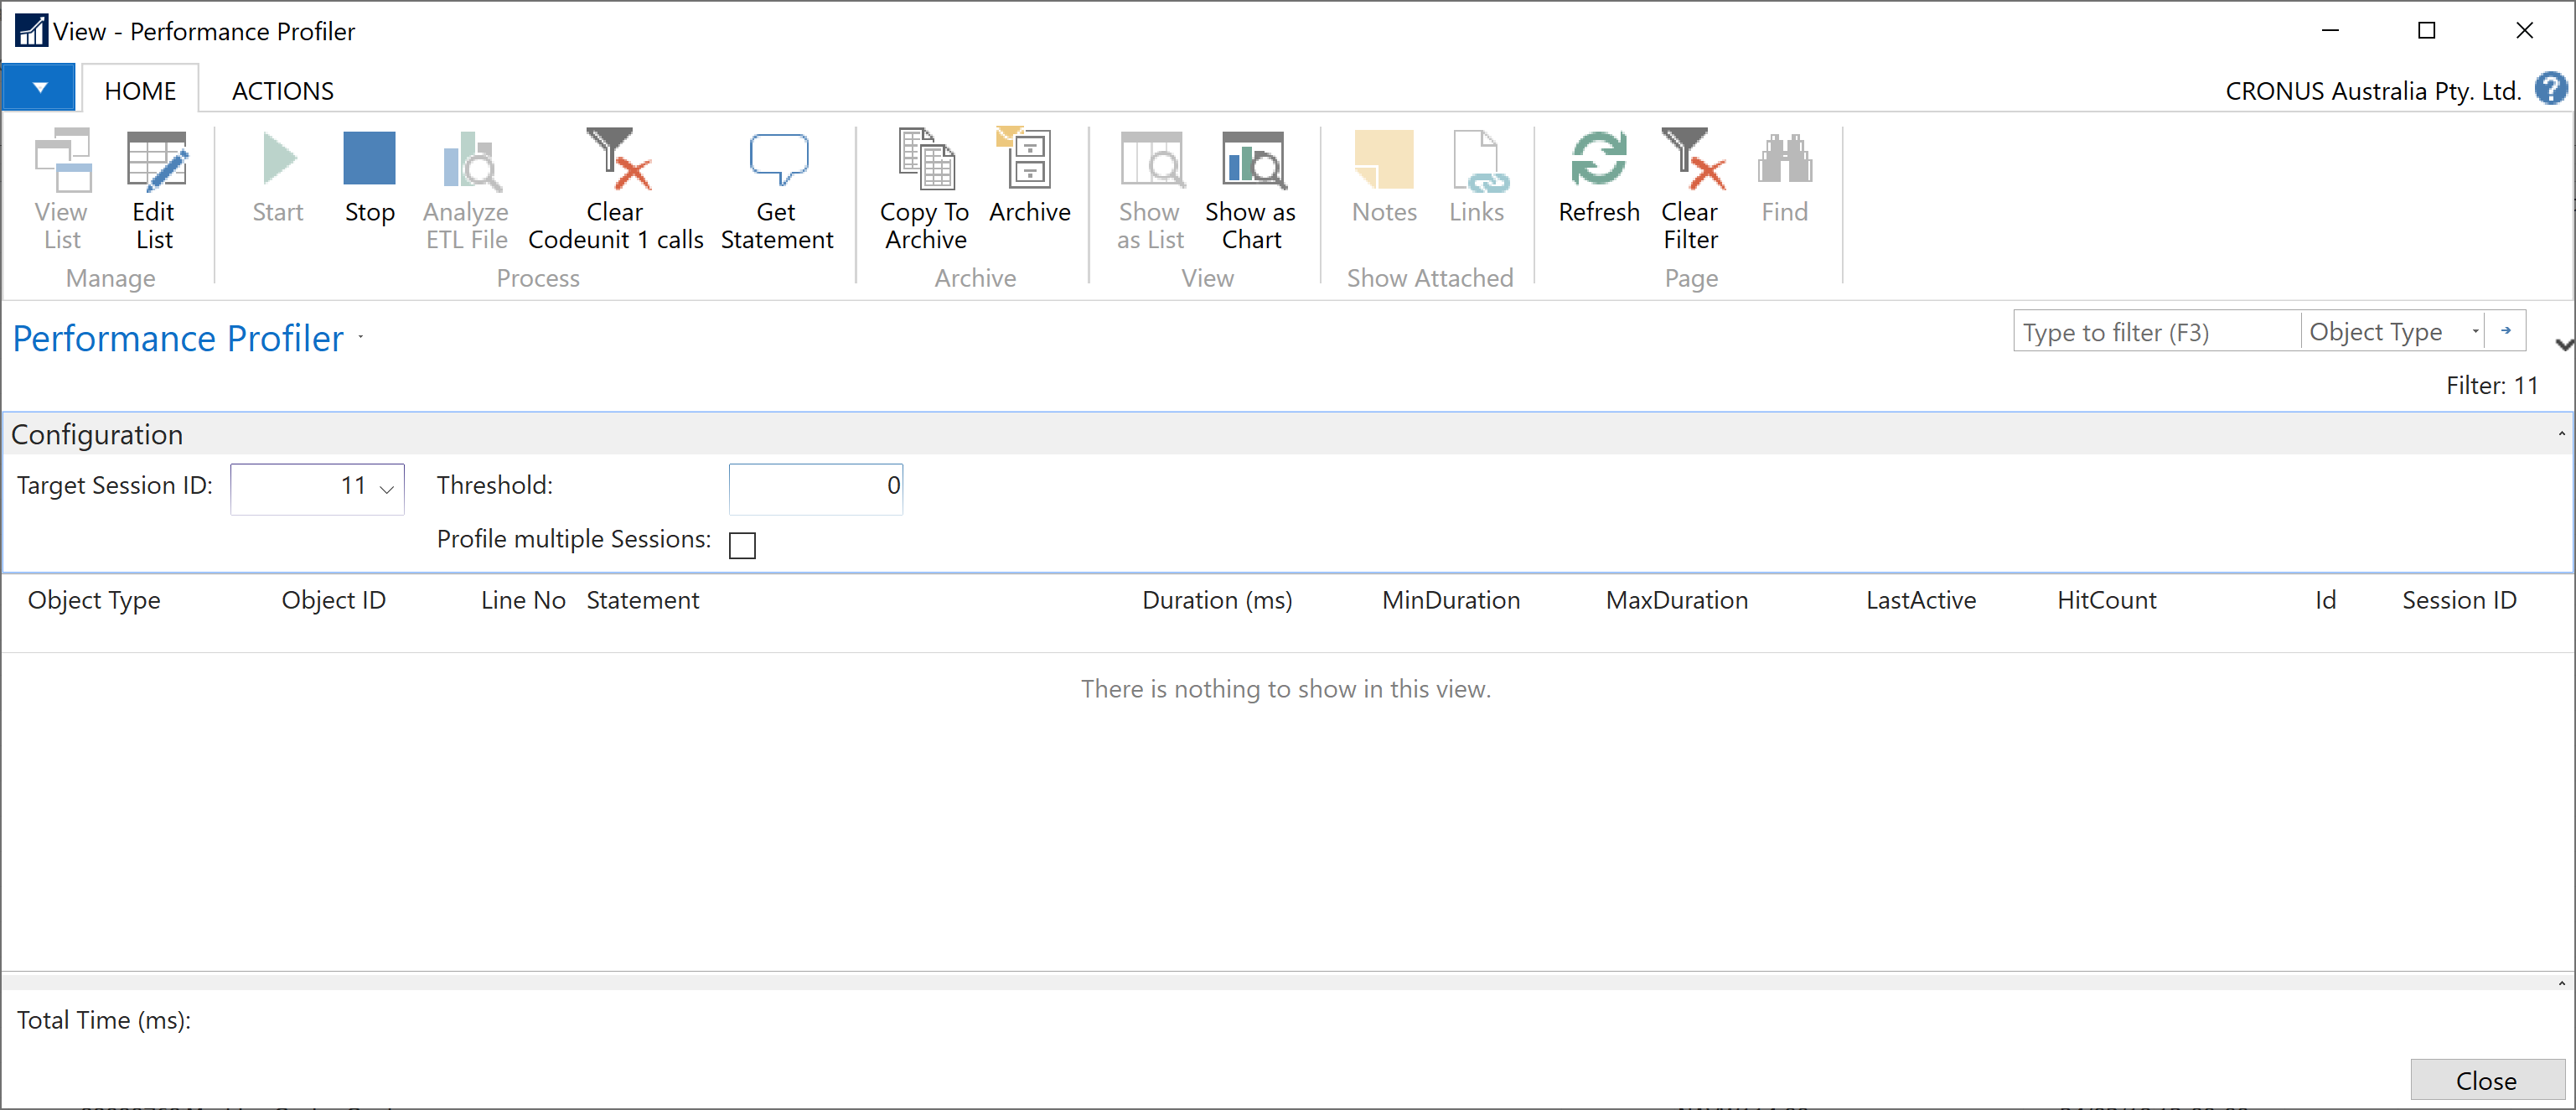
In the example below, I specified my second session as the target session and hit the Start action button to get the ball rolling.
Now, using the second client, we could run the code that concerns us. I'm going to open the Vendors page and then stop the profiler.
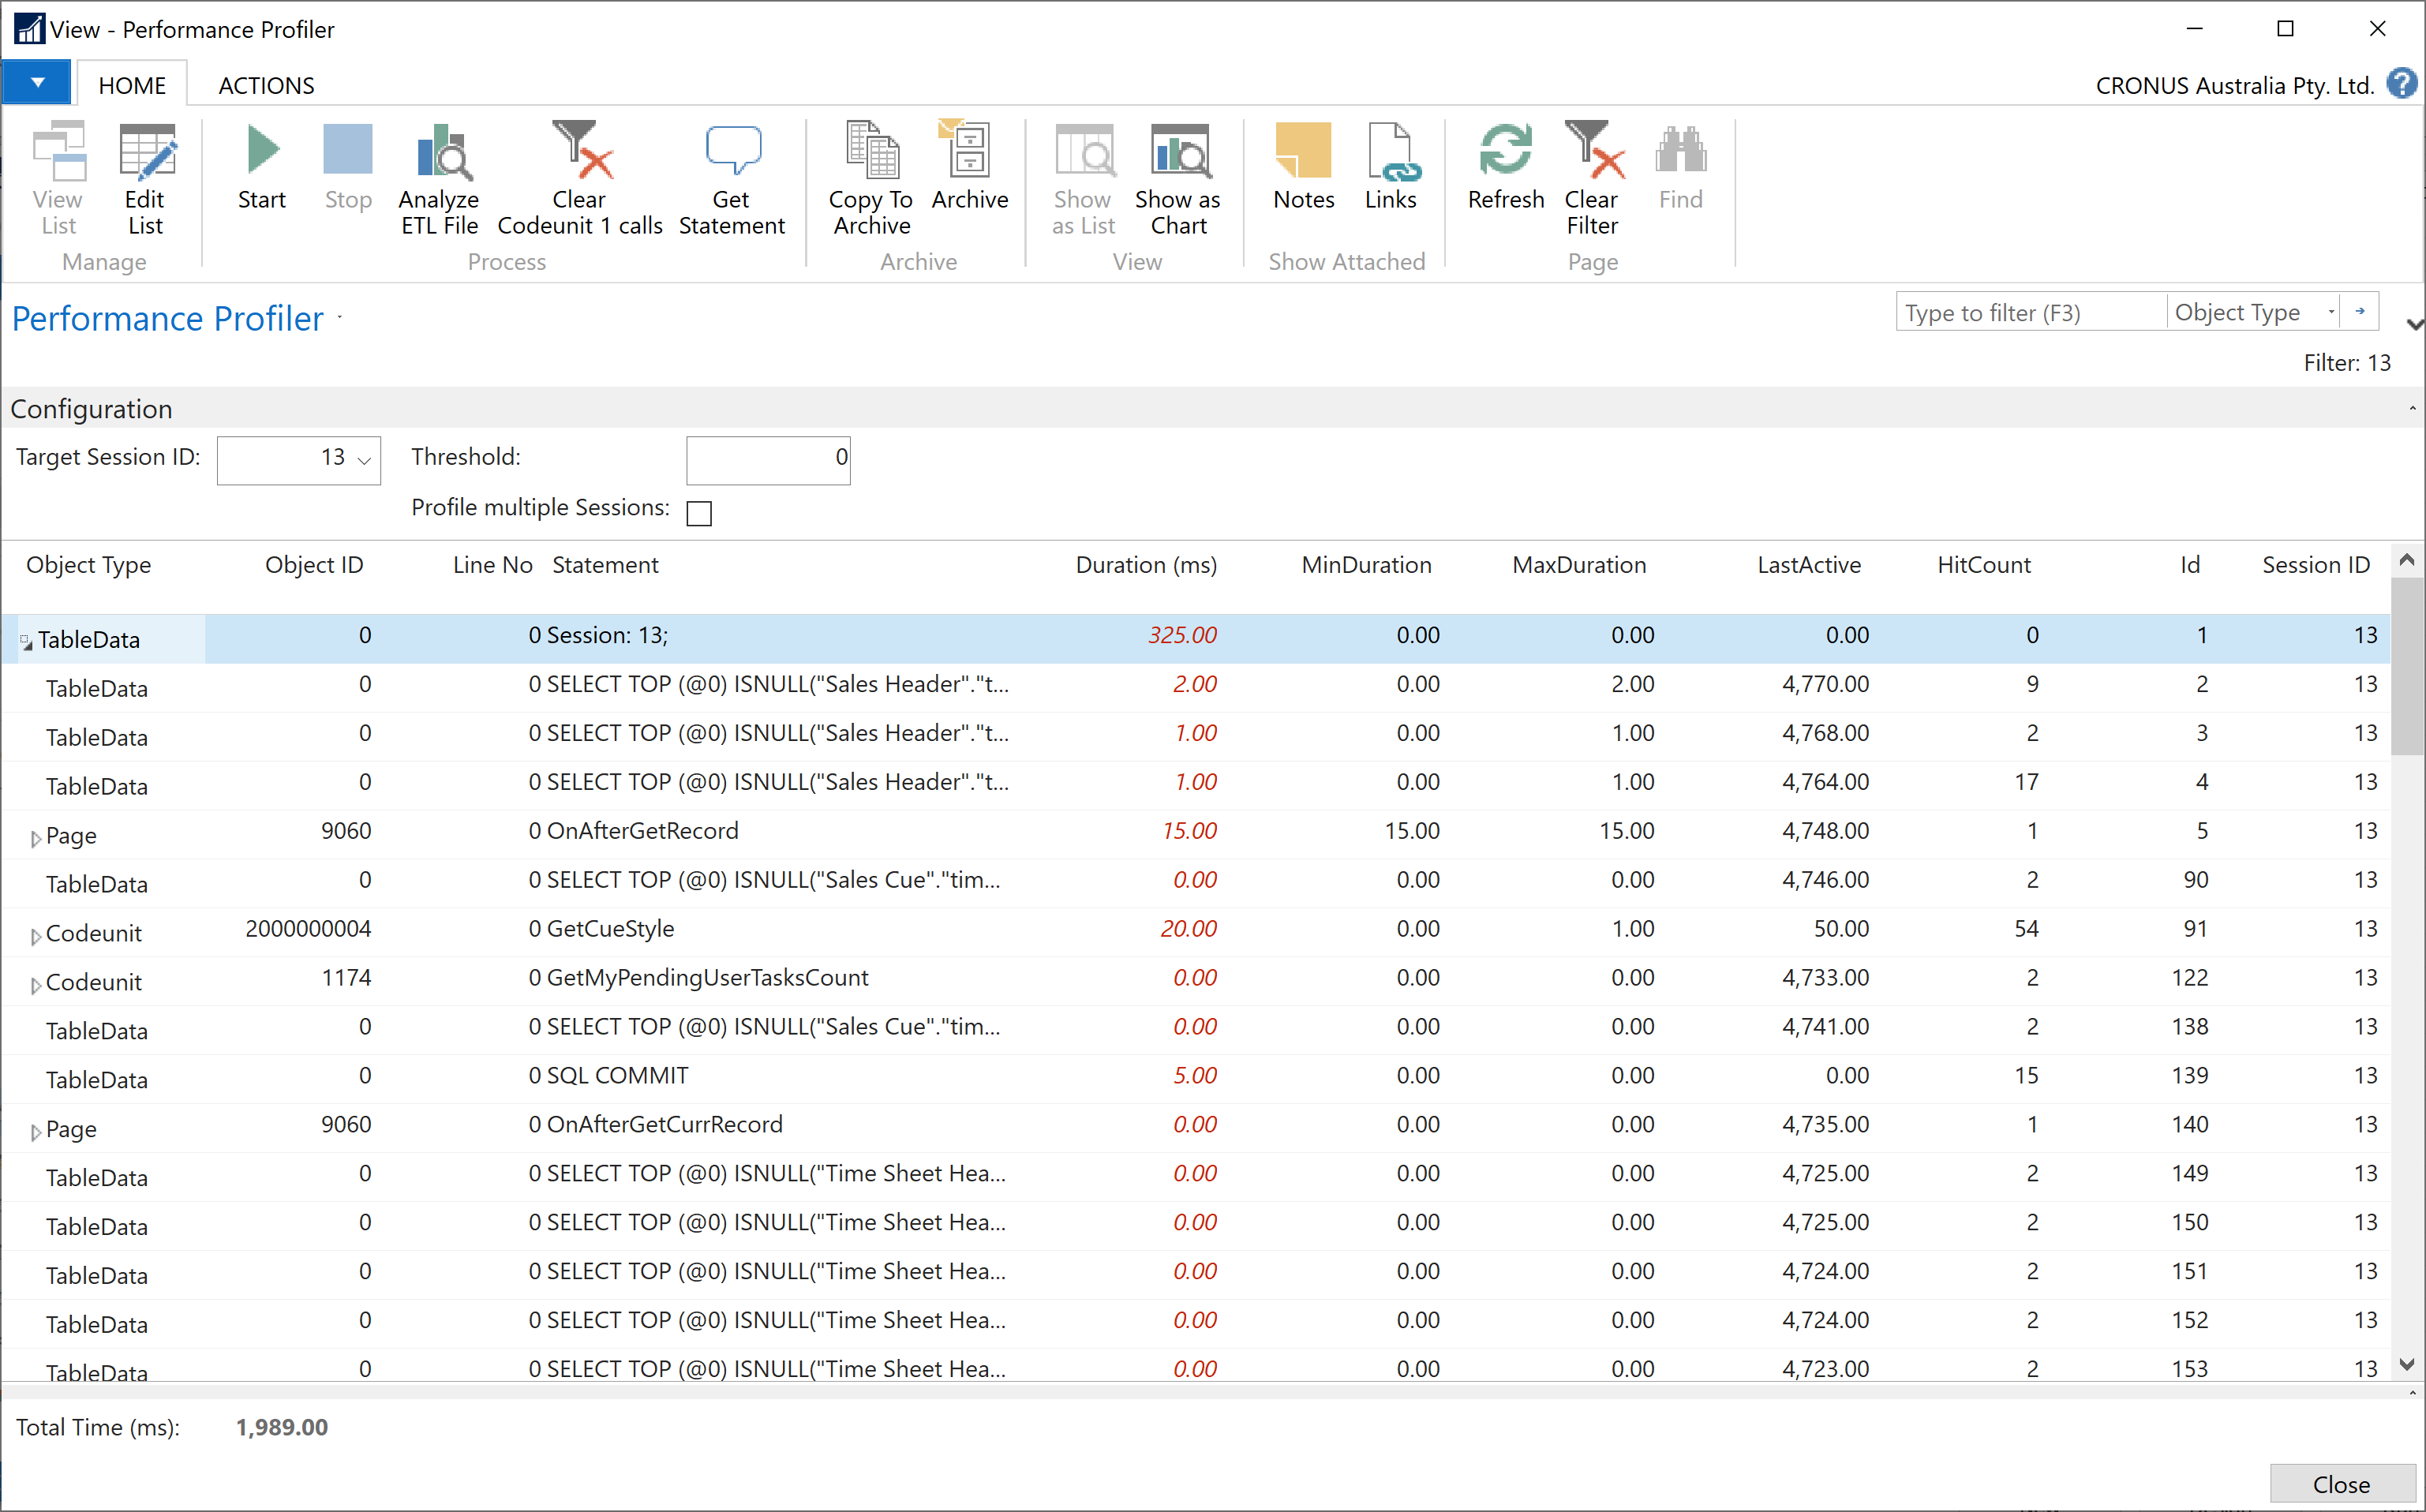
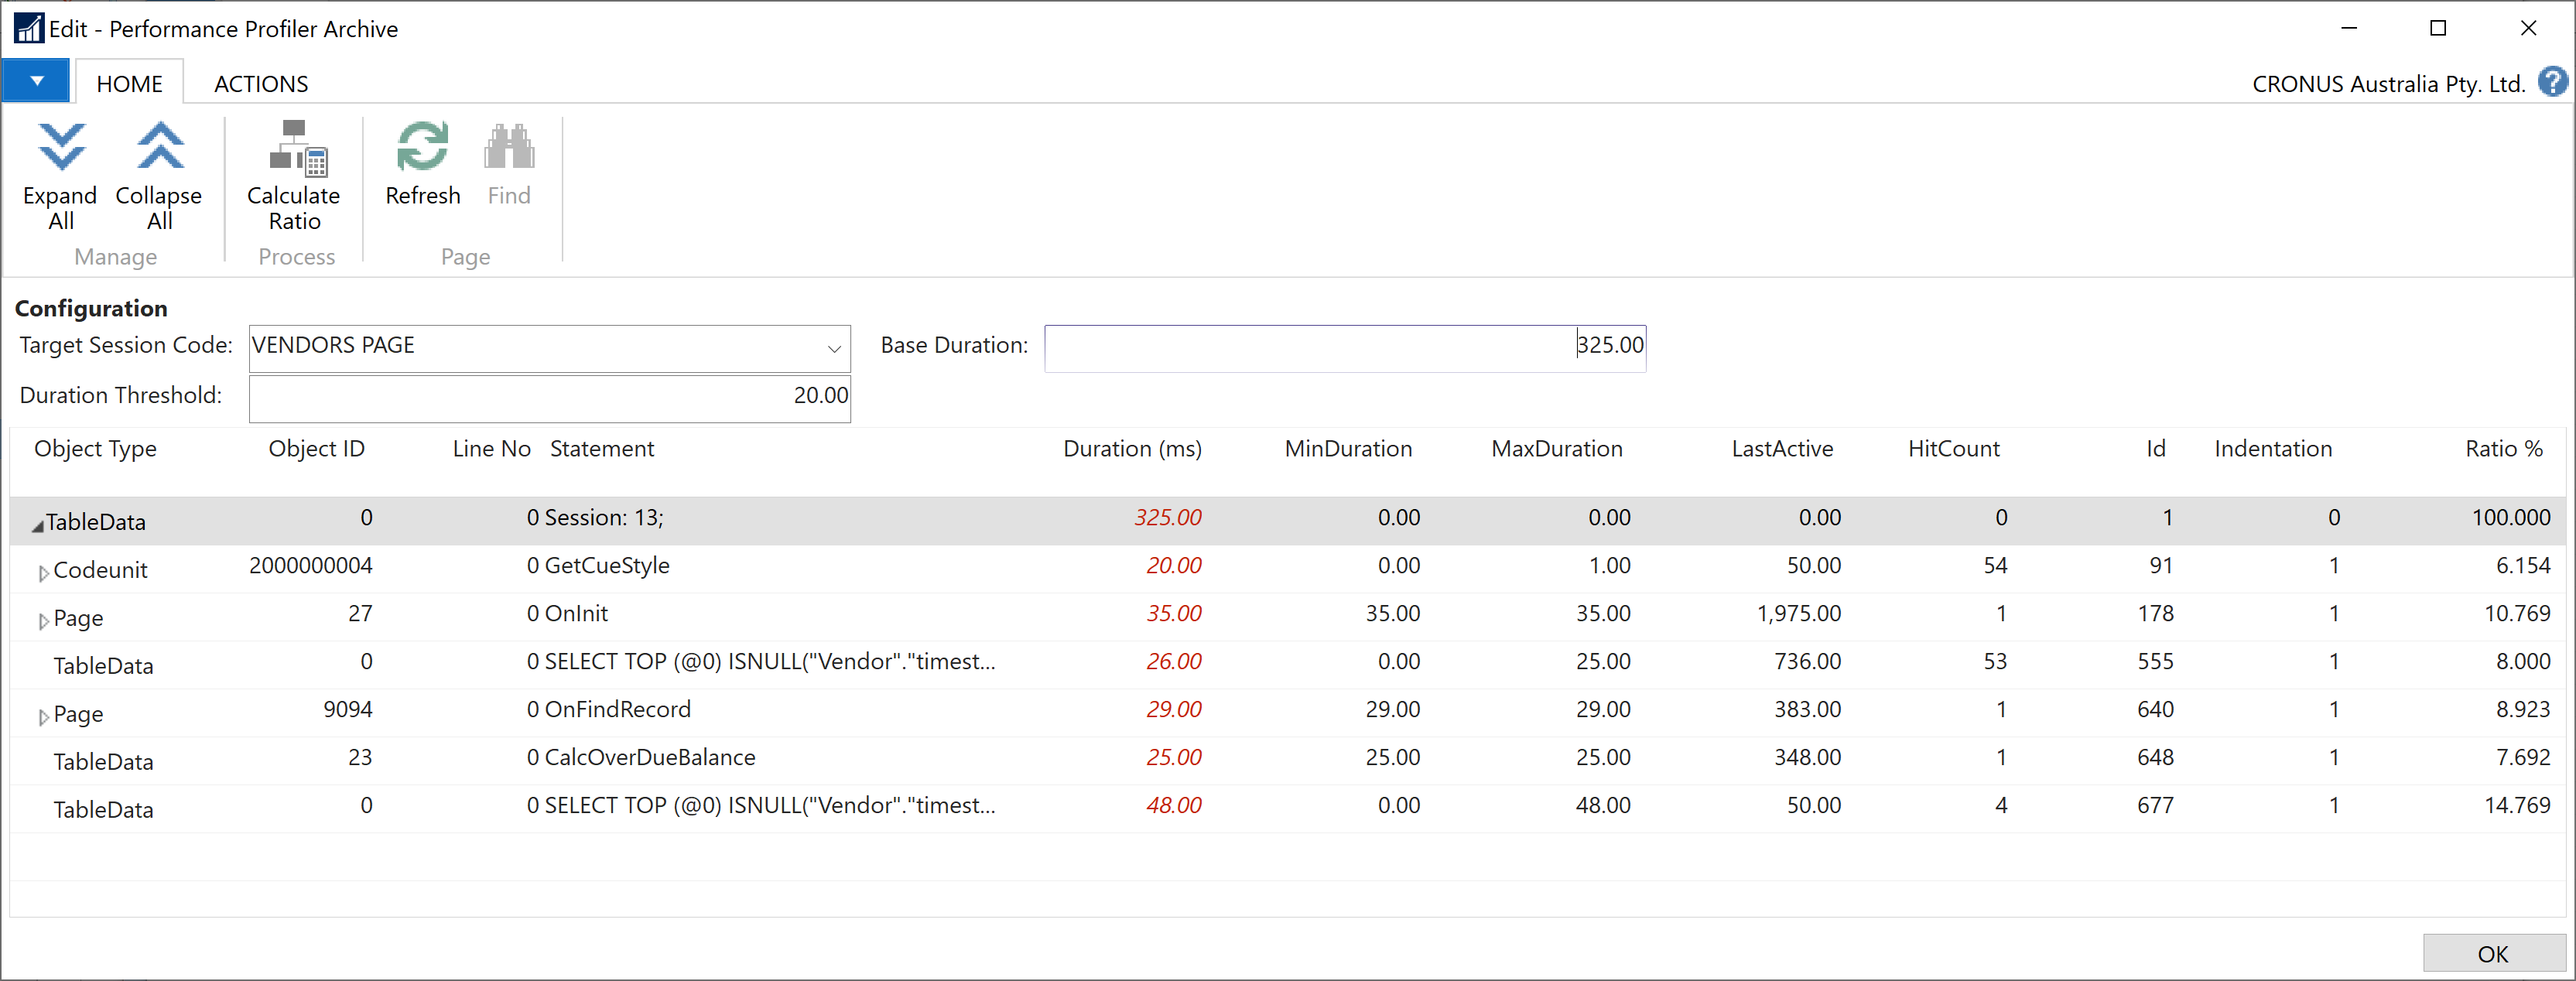
After tracing data is collected, it's read by NAV Application Profiler and aggregated into the table with a hierarchical view. We can see the Object Types, Object IDs, C/AL, and SQL statements with duration and hit counts, all ready for our analysis. How amazing is that? If you are looking for a particular statement, you could try filtering the Statement column specifying *<my statement substring>* as the filter value and see how well that code line behaves itself.
The Copy To Archive function lets us save the results in the database to be able to refer to it later. The Archive action button can be used to open archived traced data.
Summary
Deploying NAV Application Profiler to an on-premise Business Central or NAV can be a life-changer. I have caught myself multiple times already wrongly assuming a particular area was the culprit of the performance degradation. This tool can provide us with facts to address problems quickly and directly.
Business Central 2019 wave 1 (version 14) is going to stay with us for some time considering the next versions support AL applications only. Its mainstream support end date has already been moved to October 10, 2023, according to the Fixed Lifecycle Policy. Even if all the customization logic has been moved to AL, there are some cloud limitations like the database size of 80 GB or other reasons that would make you choose to stay an on-premises customer. The C/AL NAV Application Profiler objects can be converted to AL and you should still be able to use it happily after.
Although NAV Application Profiler can help troubleshoot performance issues significantly, it is best to avoid them at the design stage. Great places to look at to master the skill are the performance articles for developers and numerous Dynamics 365 BC community blog posts (like this one by Roberto Stefanetti).
I hope you enjoyed reading this post and the performance profiler helps to make your application or customization more efficient and your BC users happier.
Additional Tips
Deploy NAV Application Profiler to a Container
A BC container version 14 was used for the examples in this article. Below are the steps and scripts that were used.
$containerName = 'bc14dev'
$imageName = "mcr.microsoft.com/businesscentral/onprem:14.11.41204.0-au"

$credential = New-Object pscredential 'dev', (ConvertTo-SecureString -String 'dev' -AsPlainText -Force)

Measure-Command {
    New-BCContainer -accept_eula `
        -accept_outdated `
        -containerName $containerName `
        -imageName $imageName `
        -auth UserPassword `
        -credential $credential `
        -doNotExportObjectsToText `
        -memoryLimit 10G `
        -updateHosts `
        -includeCSide `
        -myscripts @()
}In order to import the text files and modify them, a license might be required. You should be able to import the fob file with all objects in any case.
Once the container is running, I ran the following
cd C:\Temp\NAVAppProfiler\ # your unzipped folder
Compress-Archive -Path .\EtwPerformanceProfiler\* -DestinationPath .\EtwPerformanceProfiler.zip
Copy-FileToBcContainer -containerName bc14dev -localPath .\EtwPerformanceProfiler.zip -containerPath 'c:\Temp\EtwPerformanceProfiler.zip'
Open-BcContainer bc14dev
The below commands were executed in the container PowerShell session.
Expand-Archive -Path C:\Temp\EtwPerformanceProfiler.zip -DestinationPath C:\Temp\EtwPerformanceProfiler\
Copy-Item -Path "C:\Temp\EtwPerformanceProfiler\" -Destination "C:\Program Files\Microsoft Dynamics NAV\140\Service\Add-ins\" -Recurse
Set-NAVServerConfiguration -ServerInstance nav -KeyName EnableFullALFunctionTracing -KeyValue true
Get-NAVServerInstance | Restart-NAVServerInstance -Force -VerboseBC Container Helper creates the RoleTailered Client folder on your machine, therefore the libraries need to be copied to C:\ProgramData\BcContainerHelper\Extensions\bc14dev\Program Files\140\RoleTailored Client\Add-ins to be able to compile the objects in NAV Development Environment.
The final step is importing the BC objects, compiling them with the Synchronize Schema option set to Later, and tenant synchronization with the following command in the container's PowerShell terminal.
Get-NAVServerInstance | Sync-NAVTenant -Force -Verbose